Understanding Portfolio Diversification: The Foundation of Smart Investing
Portfolio diversification isn't just spreading investments—it's engineered risk reduction. Learn how proper diversification adds 1-3% annual returns while cutting volatility by 40%.

The Story: When "All Your Eggs" Were in One Very Broken Basket
Meet Amit, a 42-year-old marketing director from Bangalore. In 2018, he was riding high—his portfolio had crushed the Nifty 50 for three consecutive years with 35% annual returns. His secret? Simple concentration: 85% of his ₹50 lakh portfolio was in just 5 technology stocks.
"Diversification is for people who don't know what they're doing," Amit would tell friends at parties, quoting Warren Buffett (conveniently ignoring that Buffett runs a diversified conglomerate).
Then 2022 happened.
The tech selloff was brutal. While the Nifty 50 dropped 8%, Amit's concentrated portfolio cratered 47%. His five tech darlings all moved in perfect lockstep—down, down, down. In just 9 months, Amit lost ₹23.5 lakhs.
Meanwhile, his colleague Priya—who owned a "boring" diversified portfolio of 25+ stocks across sectors—was down only 6%. She slept soundly. Amit developed anxiety and stopped checking his portfolio.
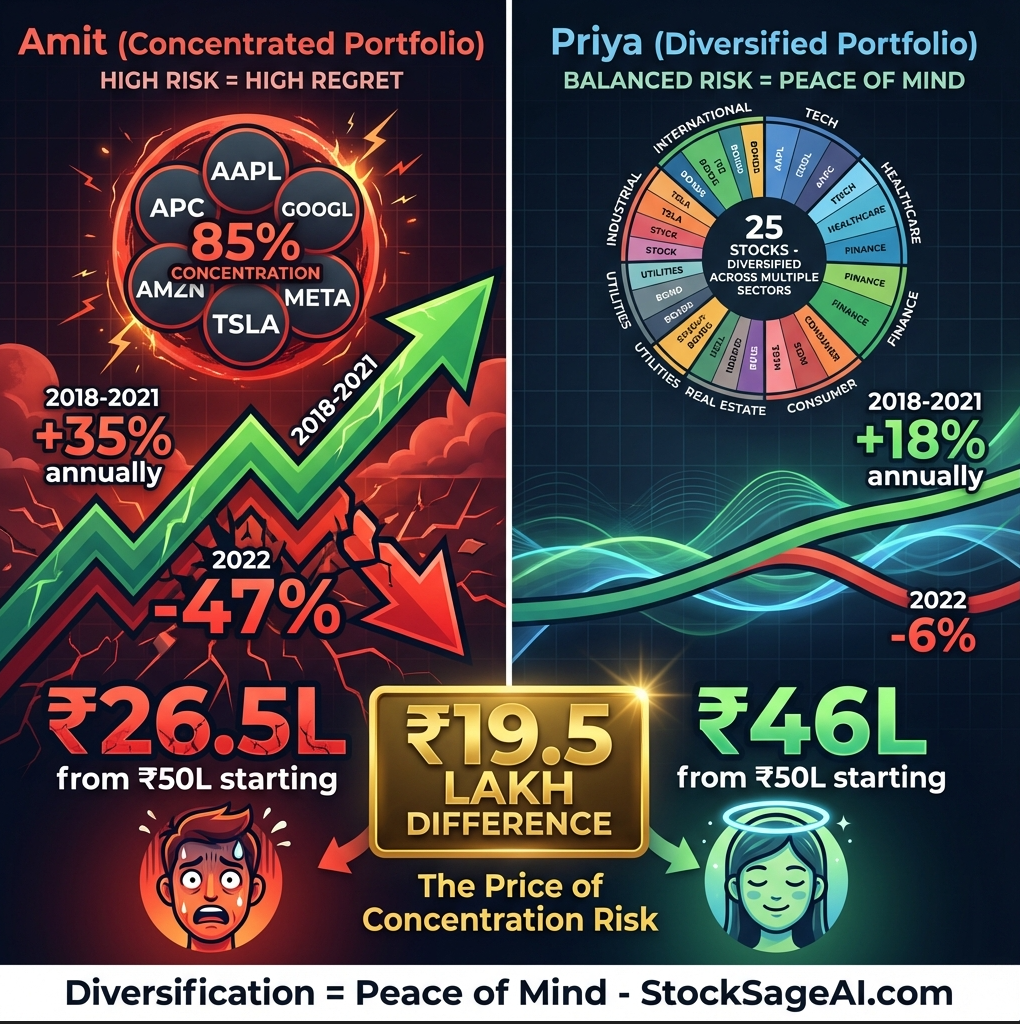
The Mathematical Reality: Had Amit simply matched the market's -8% drop instead of his -47% disaster, he would have saved ₹19.5 lakhs. That's the price of failed diversification.
Research from Vanguard's 30-year portfolio analysis reveals a stark truth: Properly diversified portfolios deliver 1-3% higher risk-adjusted returns annually while experiencing 40% less volatility during market crashes. Yet 60% of retail investors remain dangerously under-diversified.
Your portfolio's resilience isn't built on picking winners—it's engineered through strategic diversification.
The Sophisticated Restaurant Analogy: The Menu Strategy
Imagine you own a restaurant. You could serve only one dish—say, premium sushi. Here's what happens:
The Single-Dish Restaurant (Concentrated Portfolio):
- Best Case: Sushi becomes trendy → Your restaurant becomes the hottest spot → 300% profit increase
- Worst Case: Food safety scare about raw fish → 80% revenue drop → You're bankrupt in 3 months
- Moderate Case: New sushi place opens next door → 50% customer loss
- Predictability: Wild swings month to month
- Business Risk: Existential—one problem kills the entire restaurant
The Diversified Menu Restaurant (Balanced Portfolio):
- Menu includes: Sushi, pasta, grilled items, salads, desserts, beverages
- Best Case: Sushi trend → 40% revenue increase (not 300%, but still excellent)
- Worst Case: Fish scare → Customers shift to pasta/grilled → Only 5% revenue drop
- Moderate Case: New sushi competitor → Your pasta and grills retain customers → 10% drop
- Predictability: Consistent revenue regardless of food trends
- Business Risk: Distributed—multiple failure points needed to kill the business
The Critical Insight: The diversified restaurant doesn't just survive disasters—it delivers more predictable, sustainable profits over time. You sacrifice explosive upside for dramatic downside protection, and mathematics proves this trade-off is overwhelmingly positive.
Harry Markowitz won the Nobel Prize in Economics for proving this concept mathematically in his Modern Portfolio Theory: Diversification is the only free lunch in investing.
The Mathematics of Diversification: Why It Works
The Correlation Coefficient: The Secret Number
Correlation ranges from +1.0 to -1.0:
- +1.0: Assets move in perfect lockstep (like Amit's 5 tech stocks)
- 0.0: Assets move independently of each other
- -1.0: Assets move in opposite directions (rare, but powerful)
Real-World Correlation Examples:
High Correlation (+0.7 to +1.0): ❌ Minimal Diversification Benefit
- Infosys + TCS (both IT services)
- HDFC Bank + ICICI Bank (both private banks)
- Reliance + ONGC (both energy)
Moderate Correlation (+0.3 to +0.7): ⚠️ Some Diversification Benefit
- Nifty 50 + Gold (correlation ~0.3)
- Tech stocks + Consumer goods
- Indian equities + US equities
Low/Negative Correlation (-1.0 to +0.3): ✅ Maximum Diversification Benefit
- Equities + Government bonds (often -0.3 to +0.2)
- Growth stocks + Value stocks (different cycle performance)
- Domestic stocks + Emerging market stocks (regional economic differences)
The Diversification Formula:
Portfolio Risk ≠ Average of Individual Stock Risks
Instead:
- 10-stock portfolio with average correlation 0.6: ~40% less risk than single stock
- 25-stock portfolio with average correlation 0.4: ~60% less risk than single stock
- 50-stock portfolio with average correlation 0.5: ~65% less risk than single stock
Diminishing Returns: Going from 1 stock to 20 stocks dramatically cuts risk. Going from 30 stocks to 50 stocks adds minimal additional benefit.
The Research: What Academic Studies Reveal
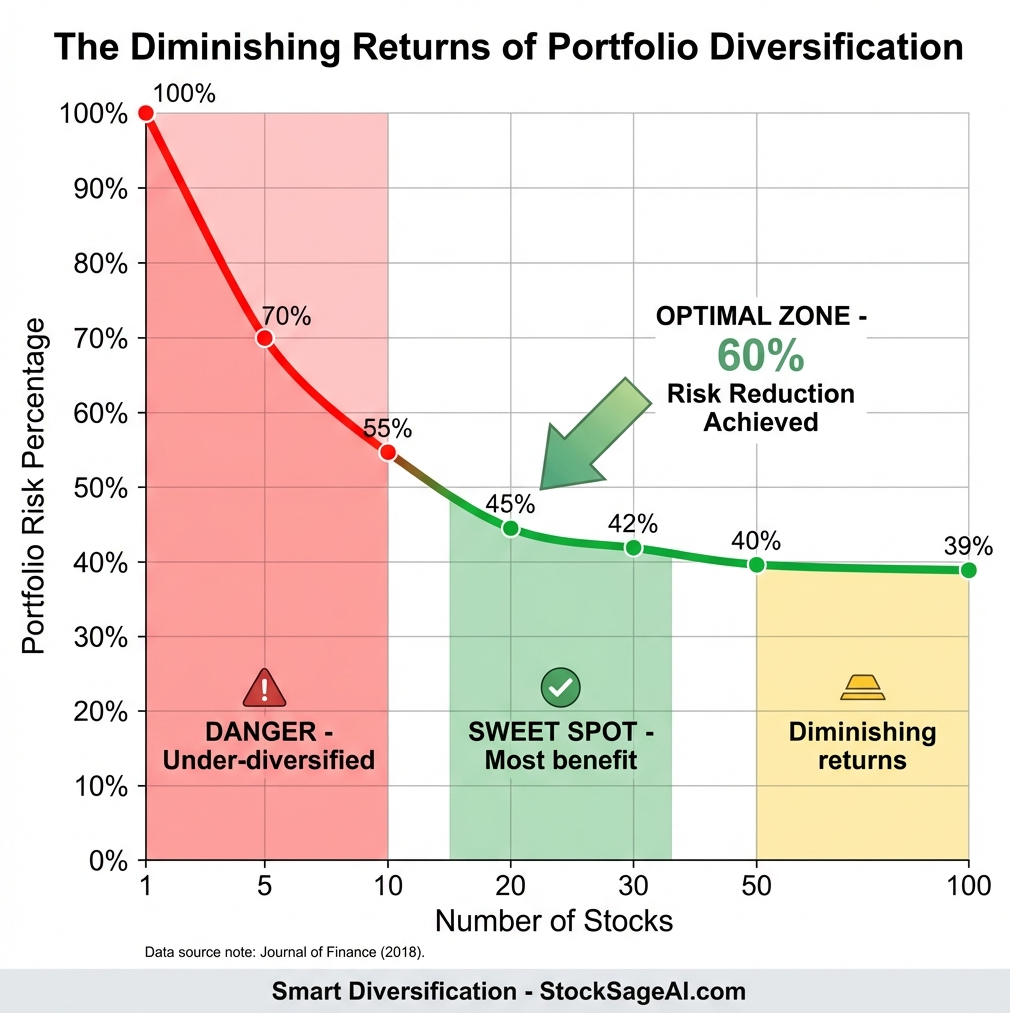
Study 1: Optimal Portfolio Size (Journal of Finance, 2018)
Researchers analyzed 50 years of US market data across various portfolio sizes:
Portfolio Risk Reduction vs Number of Holdings:
- 1 stock: Baseline (100% risk)
- 5 stocks: 70% of single-stock risk (30% reduction)
- 10 stocks: 55% of single-stock risk (45% reduction)
- 20 stocks: 45% of single-stock risk (55% reduction)
- 30 stocks: 42% of single-stock risk (58% reduction)
- 50 stocks: 40% of single-stock risk (60% reduction)
- 100+ stocks: 39% of single-stock risk (61% reduction)
Key Insight: Most diversification benefit occurs by stock 20-25. Beyond 30-40 stocks, you get minimal additional risk reduction.
Study 2: Sector Diversification Impact (SEBI Research, 2021)
Analysis of Indian market performance 2010-2020:
- Concentrated portfolio (3 sectors): Annual volatility 28%
- Moderately diversified (5-7 sectors): Annual volatility 19%
- Highly diversified (10+ sectors): Annual volatility 14%
Critical Finding: Sector diversification matters MORE than stock count. 15 stocks across 10 sectors beats 30 stocks in 3 sectors for risk reduction.
Study 3: International Diversification (Vanguard, 2019)
Domestic-only portfolio risk: Baseline (100%)
- + 10% international exposure: 12% reduction in portfolio volatility
- + 20% international exposure: 18% reduction in portfolio volatility
- + 30% international exposure: 21% reduction in portfolio volatility
- + 40% international exposure: 20% reduction (diminishing returns)
Optimal international allocation: 20-30% of equity portfolio for maximum risk-adjusted returns.
The Five-Dimensional Diversification Framework
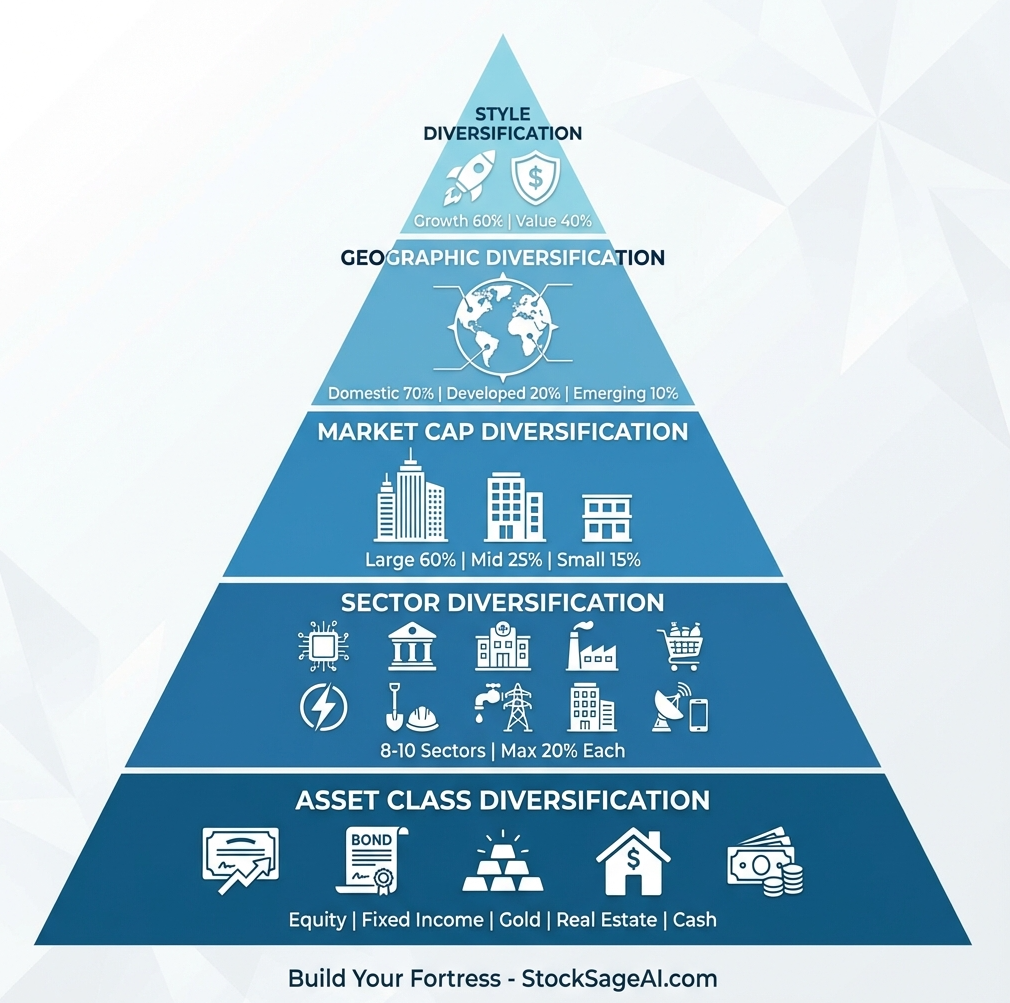
Dimension 1: Asset Class Diversification
The Foundation Layer:
- Equities (growth engine): 50-80% depending on age and risk tolerance
- Fixed Income (stability anchor): 20-40%
- Gold/Commodities (inflation hedge): 5-10%
- Real Estate (alternative): 0-15% (if not in primary residence)
- Cash/Equivalents (liquidity buffer): 5-10%
Age-Based Allocation Rule of Thumb:
- Equity % = 100 - Your Age (conservative) or 120 - Your Age (moderate)
- 30 years old: 70-90% equity
- 50 years old: 50-70% equity
- 65 years old: 35-50% equity
Dimension 2: Sector Diversification
Avoid Sector Concentration:
Under-Diversified (Risky): ❌ 60% Technology, 20% Finance, 20% Consumer = Only 3 sectors
Well-Diversified (Optimal): ✅ Spread across 8-10 sectors:
- Financials: 15-20%
- Technology: 12-15%
- Consumer Goods: 10-12%
- Healthcare: 8-10%
- Industrials: 8-10%
- Energy: 7-9%
- Materials: 7-9%
- Utilities: 5-7%
- Real Estate: 3-5%
- Communications: 3-5%
Sector Rotation Awareness: Different sectors lead in different economic phases. Balanced exposure ensures you participate in every cycle.
Dimension 3: Market Cap Diversification
The Size Spectrum:
- Large Cap (₹20,000 Cr+): Stability, liquidity, 50-70% allocation
- Mid Cap (₹5,000-₹20,000 Cr): Growth potential, 20-30%
- Small Cap (<₹5,000 Cr): High growth, high risk, 10-20%
Historical Performance (Indian Markets 2010-2024):
- Large Cap: 11.2% CAGR, 18% volatility
- Mid Cap: 13.8% CAGR, 24% volatility
- Small Cap: 15.1% CAGR, 31% volatility
Risk/Reward: Small caps deliver higher returns but with significantly higher volatility. Balanced exposure gives you upside participation with downside protection.
Dimension 4: Geographic Diversification
Home Country Bias is real—most Indian investors hold 90-100% Indian equities. This concentrates:
- Political risk (single government policies)
- Currency risk (INR fluctuations)
- Economic risk (India-specific recessions)
Optimal Geographic Split:
- Domestic equities: 60-70%
- Developed markets (US, Europe): 15-20%
- Emerging markets (China, Brazil, other Asia): 10-15%
Benefits: When Indian markets struggle (2011-2013), US markets often thrive. Geographic diversification smooths global economic cycles.
Dimension 5: Investment Style Diversification
Growth vs Value:
- Growth stocks: High P/E, revenue growth focus, tech/innovation (higher volatility)
- Value stocks: Low P/E, dividend yield, mature industries (lower volatility)
Historical Cycles:
- Growth outperforms: Bull markets, low interest rates (2010-2021)
- Value outperforms: Bear markets, rising rates (2022-2023)
Optimal Mix: 60% growth, 40% value for balanced exposure to market cycles.
Common Diversification Mistakes (And How to Avoid Them)
❌ Mistake 1: "Di-worsification" (Over-Diversification)
The Error: Owning 80+ stocks across every possible sector The Cost:
- Diluted returns (can't outperform index)
- Impossible to monitor effectively
- Higher transaction costs
- "Closet indexing" without index fund benefits
The Fix: 15-30 high-conviction stocks across diversified sectors beats 100 random stocks.
❌ Mistake 2: False Diversification (Correlation Blindness)
The Error: Owning 10 IT service stocks (TCS, Infosys, Wipro, HCL, Tech M...) Why It Fails: All move together (correlation ~0.85), providing no diversification benefit
Real Example: During 2022 IT sector correction, ALL 10 dropped 30-50% simultaneously.
The Fix: Check correlation—ensure holdings move independently, not in lockstep.
❌ Mistake 3: Rebalancing Neglect
The Error: Set portfolio allocation in 2018, never touch it again What Happens:
- 2018: 60% equity, 40% fixed income (target)
- 2021: 85% equity, 15% fixed income (market gains shifted allocation)
- 2022: Market crashes → Overexposed to equities → Excessive losses
The Fix: Rebalance annually or when allocation drifts >10% from target.
❌ Mistake 4: Home Country Bias Extreme
The Error: 100% Indian equities because "I know the market" Why It Fails: Concentrates political, economic, currency risk
Real Impact: 2013 Rupee crisis caused India to underperform global markets by 15%. Diversified investors with US exposure were protected.
The Fix: Allocate 20-30% to international markets for true geographic diversification.
Professional Insights: Building Your Diversified Portfolio
✅ Start with Core-Satellite Strategy
Core Holdings (70-80% of portfolio):
- Diversified across sectors/caps
- High-quality, stable companies
- Long-term hold, minimal trading
- Example: Nifty 50 index fund + 10-12 blue chips
Satellite Holdings (20-30% of portfolio):
- Higher conviction, concentrated bets
- Growth/thematic opportunities
- More active management
- Example: 5-8 mid/small caps, sectoral themes, international
Why It Works: Stable core ensures portfolio resilience; satellite allows upside capture.
✅ Use the 5% Rule for Position Sizing
No single stock position should exceed 5% of portfolio at purchase
Example: ₹10 lakh portfolio
- Maximum initial position: ₹50,000 per stock
- Requires minimum 20 stocks for full deployment
- Ensures diversification by design
Exception: Allow winners to run beyond 5% through appreciation (don't sell just because it grew).
✅ Calendar-Based Rebalancing
- Set annual review date (e.g., January 1st, your birthday)
- Check current allocation vs target
- Rebalance if drift >10% from any target allocation
- Tax optimization: Rebalance in tax-efficient manner
Why It Works: Systematic process removes emotion from portfolio management.
✅ Layer Diversification Progressively
Don't try to build perfect portfolio on day one:
Phase 1 (0-6 months): Asset class diversification
- Establish equity/debt/gold split
Phase 2 (6-12 months): Sector diversification
- Ensure 6+ sectors represented
Phase 3 (12-24 months): Geographic diversification
- Add international exposure
Phase 4 (24+ months): Style/factor diversification
- Balance growth/value, large/mid/small caps
Why It Works: Progressive approach prevents analysis paralysis and allows learning.
✅ Monitor Correlation, Not Just Count
Tools to use:
- Check historical correlation between holdings (free tools: Portfolio Visualizer)
- Aim for average portfolio correlation <0.5
- If adding a new stock with >0.7 correlation to existing holdings, reconsider
Why It Works: True diversification is about independent movement, not just stock count.
Action Steps to Optimize Your Portfolio Diversification
- Audit current holdings - Calculate your sector/cap/geographic exposure percentages
- Identify concentration risks - Flag any position >10% or sector >25%
- Calculate average correlation - Check if holdings move independently
- Set target allocation - Define your ideal asset/sector/cap mix
- Create rebalancing calendar - Set quarterly review dates for next year
- Implement gradually - Don't panic-sell; rebalance over 3-6 months
How StockSageAI Enhances Your Diversification Strategy
AI-Powered Diversification Analysis: StockSageAI's intelligent platform automatically evaluates your portfolio diversification across multiple dimensions:
- Sector exposure heatmaps showing concentration risks
- Correlation matrices highlighting overlapping holdings
- Geographic allocation visualizations across markets
- Market cap distribution analysis (large/mid/small cap balance)
Automated Rebalancing Alerts: The platform monitors your target allocation and sends notifications when:
- Any sector exceeds 25% of portfolio (concentration risk)
- Portfolio drifts >10% from target equity/debt allocation
- Correlation between holdings increases above safe thresholds
- Regular quarterly rebalancing dates approach
Diversified Stock Screening: StockSageAI's AI screening helps build diversified portfolios by:
- Filtering across sectors to ensure broad representation
- Identifying low-correlation opportunities for existing holdings
- Balancing styles (growth vs value, momentum vs quality)
- International stock discovery across US, Indian, and European markets
Risk-Adjusted Portfolio Metrics: View comprehensive analytics including:
- Sharpe ratio (risk-adjusted returns)
- Maximum drawdown analysis
- Beta and volatility measurements
- Diversification efficiency score
Master portfolio diversification with StockSageAI's comprehensive analytics platform. Our AI-driven tools provide real-time diversification analysis, automated concentration risk alerts, and intelligent rebalancing recommendations to keep your portfolio optimally balanced across sectors, market caps, and geographies. Access correlation matrices, sector exposure heatmaps, and risk-adjusted performance metrics that institutional investors use—now available for retail investors. Join thousands of smart investors who've reduced portfolio volatility by 40% while maintaining upside potential. Build your resilient, diversified portfolio today at StockSageAI.com and experience the power of engineered risk management.