The Premium Price Trap - Why Today's Market Might Be a 67% Markup
Discover why the S&P 500's current 67.5% overvaluation creates a dangerous premium trap for investors. Learn to identify fairly priced quality companies when markets are expensive and avoid the costly mistake of overpaying for earnings.
You discover your favorite coffee shop is charging $12 for a latte that costs $7 everywhere else. Do you pay the premium or find a better deal? The stock market is currently doing the same thing.
The Story: Meet Alex, a smart shopper who always compares prices before buying. At Store A, a jacket costs $100. At Store B, the identical jacket costs $167. Alex immediately knows Store B is overpriced by 67%.
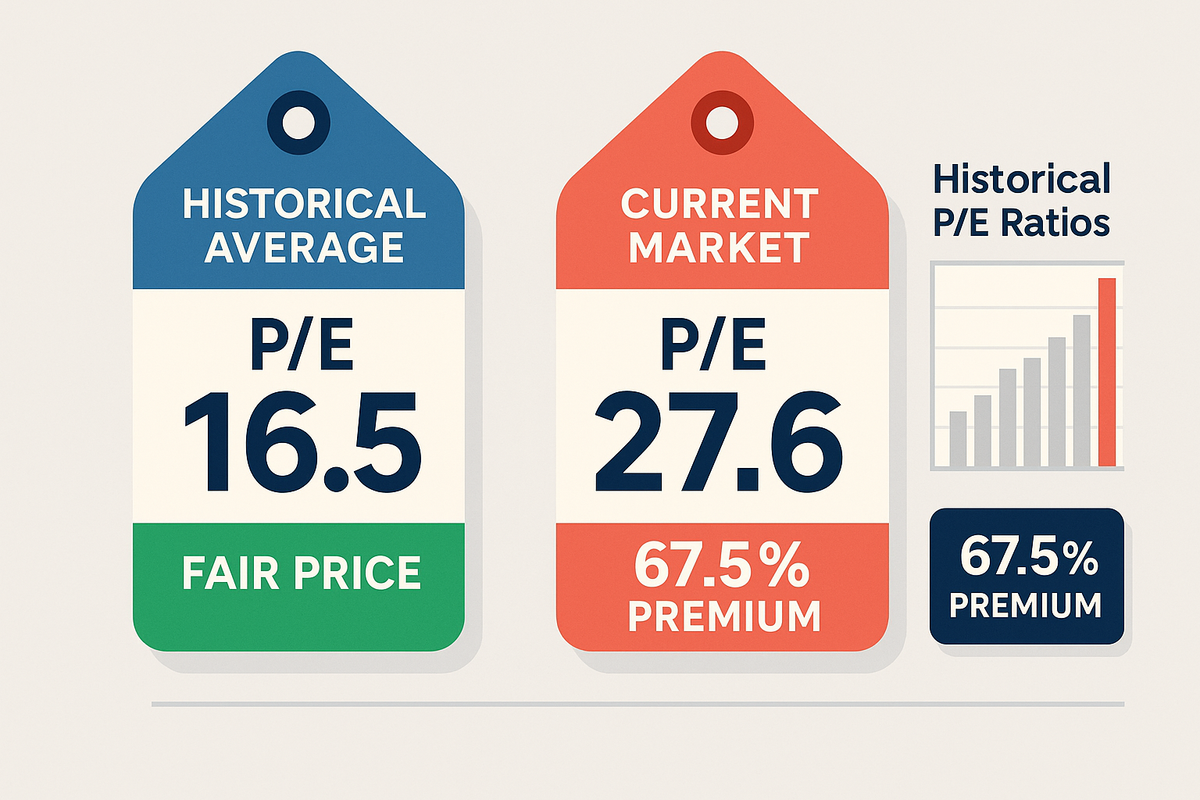
The Market's Price Tag Problem: According to current market valuation data, the S&P 500 is trading at a P/E ratio that's 67.5% above its historical average - exactly like Alex's overpriced jacket scenario.
Breaking Down the Numbers: Historical Average P/E: 16.5 Current P/E (2025): 27.6
Premium: 67.5% overvaluation
What This Means in Simple Terms: If stocks were priced normally, you'd pay $16.50 for every dollar of company earnings. Today, you're paying $27.60 for that same dollar of earnings.
The Tale of Two Investors:
Sarah (Smart Shopper):
- Recognizes overvaluation
- Waits for better prices or finds undervalued opportunities
- Focuses on companies with strong fundamentals at reasonable prices
Mike (Impulse Buyer):
- Ignores valuation warnings
- Buys popular stocks at any price
- Gets caught when market corrects to normal levels
Current Market Reality Check: Forward P/E Ratios (2025 data):
- Growth Stocks: 28.1 (expensive even for growth)
- Value Stocks: 16.8 (closer to reasonable)
- Technology Sector: 30+ (extreme premium)
- Utilities: 14-16 (fairly valued)
The Valuation Spectrum: Think of P/E ratios like price tags at different stores:
Bargain Bin (P/E 10-15): Great deals, often overlooked companies Regular Price (P/E 15-20): Fair value for average companies
Premium Brand (P/E 20-25): High quality, expect strong growth Luxury Store (P/E 25-30): Only worth it for exceptional companies Tourist Trap (P/E 30+): Proceed with extreme caution
Smart Strategies for Overvalued Markets:
- Focus on Quality: Buy excellent companies even at fair prices
- Dollar-Cost Average: Spread purchases over time to avoid timing mistakes
- International Diversification: Look at less expensive global markets
- Sector Rotation: Find undervalued sectors within expensive markets
Warning Signs to Watch:
- P/E ratios above 25 in mature companies
- Revenue growth not matching valuation premiums
- Everyone talking about "this time is different"
- Widespread market euphoria
Action Steps:
- Check P/E ratios before buying any stock
- Compare to historical averages (10-year sector averages)
- Ask yourself: "Would I pay this price for the entire business?"
Think About This: If you wouldn't pay $167 for a $100 jacket, why pay 67% above average for stocks? Sometimes the best investment decision is patience.
Avoid the premium price trap with StockSageAI's comprehensive valuation screening tools. Our platform analyzes P/E ratios across historical averages, compares companies to industry peers, and identifies undervalued opportunities in overpriced markets. Access advanced valuation metrics including PEG ratios, forward P/E analysis, and fair value estimates across US, Indian, and European markets. Start your valuation analysis with our free screening tools at StockSageAI.com and never overpay for quality again.