The International Investing Opportunity - Why 50% of Your Money Should Leave America
Discover hidden value in international markets where quality companies trade at 30-50% discounts to expensive U.S. stocks. Learn why diversifying beyond home country bias can significantly improve returns and reduce portfolio risk through global allocation strategies.
While American investors chase overpriced U.S. stocks, international markets are serving up quality companies at 30-50% discounts. The biggest opportunity might be the one you're ignoring.
The Story: Imagine if every restaurant in your city raised prices by 50%, but restaurants in the next city kept prices normal with identical food quality. Where would smart diners go? Yet most American investors keep eating at the expensive home restaurants.
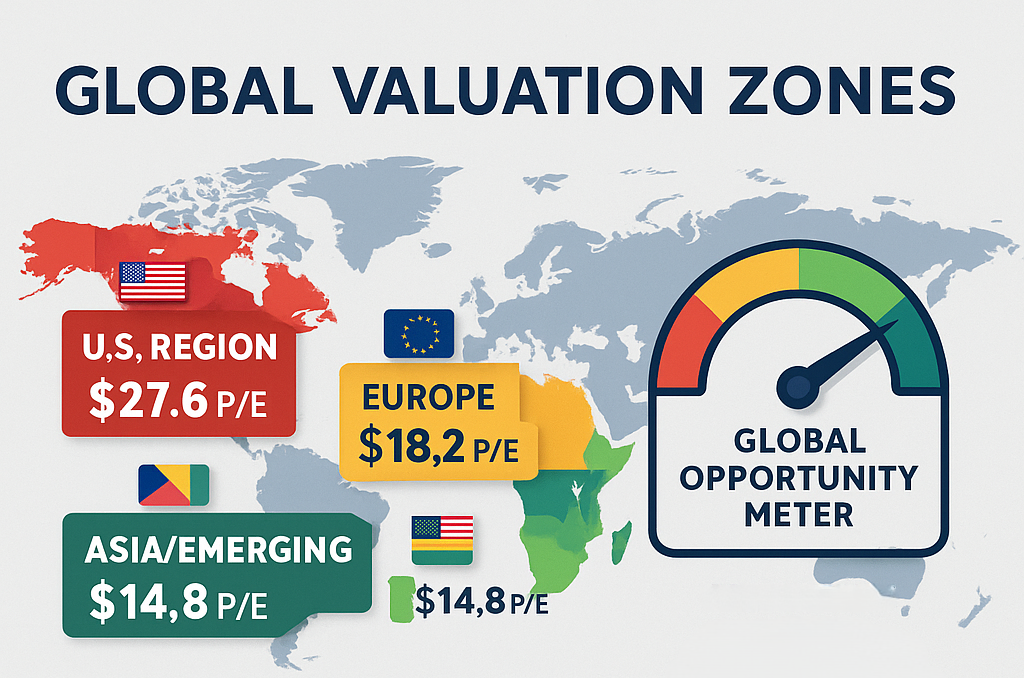
The Valuation Gap Reality:
U.S. Market (S&P 500): P/E ratio 27.6 (67% above historical average) International Developed: P/E ratio 18.2 (fair value)
Emerging Markets: P/E ratio 14.8 (attractive value)
Translation: You're paying $27.60 for $1 of U.S. earnings, but only $14.80 for $1 of emerging market earnings.
The Home Country Bias Trap: Average American portfolio allocation:
- U.S. stocks: 85%
- International: 15%
Optimal global allocation based on market size:
- U.S. stocks: 50%
- International: 50%
Why Americans Avoid International Investing:
❌ "I don't understand foreign companies"
❌ "Currency risk is too scary"
❌ "U.S. companies are the best"
❌ "International markets are riskier"
❌ "I can't pronounce their names"
The Reality Check: Many "American" companies generate more revenue internationally than domestically:
- Apple: 65% of revenue from international markets
- Microsoft: 55% international revenue
- McDonald's: 65% international revenue
International Opportunities by Region:
European Markets: Advantages:
✅ Mature, stable economies (Germany, Switzerland, Netherlands)
✅ Strong regulatory framework (consumer protection)
✅ World-class companies (Nestlé, ASML, SAP)
✅ Attractive valuations (P/E ratios 15-18)
Examples of Quality European Companies:
- ASML (Netherlands): Monopoly in advanced semiconductor equipment
- Nestlé (Switzerland): Global consumer brands powerhouse
- SAP (Germany): Enterprise software leader
Asian Developed Markets: Japan Advantages:
✅ Corporate governance improvements (shareholder-friendly reforms)
✅ Attractive valuations (P/E ratios 12-15)
✅ Currency diversification (yen hedge against dollar)
✅ Quality exporters (Toyota, Sony, Nintendo)
Examples of Quality Japanese Companies:
- Toyota: World's most efficient automaker
- Sony: Entertainment and technology powerhouse
- Keyence: Industrial automation leader
Emerging Markets: Advantages:
✅ Younger demographics (growing consumer base)
✅ Lower labor costs (manufacturing advantages)
✅ Commodity exposure (inflation hedge)
✅ Deep value opportunities (P/E ratios 10-15)
Quality Emerging Market Companies:
- Taiwan Semiconductor (Taiwan): World's largest chip manufacturer
- Tencent (China): Digital ecosystem giant
- MercadoLibre (Argentina): Latin American e-commerce leader
The Currency Question: Currency Risk Reality Check:
Short-term: Currencies fluctuate, creating volatility Long-term: Quality companies adapt and thrive regardless Hedging: Available through currency-hedged ETFs if desired
Historical Evidence: Over 20+ year periods, currency impacts tend to even out while company fundamentals drive returns.
International Diversification Benefits:
Risk Reduction:
- U.S. recession: International markets may outperform
- Dollar weakness: International investments gain value
- Sector concentration: Different countries emphasize different industries
Return Enhancement:
- Mean reversion: Outperformance rotates between regions over time
- Value opportunities: Buy quality at discounts in underperforming regions
- Growth diversification: Emerging markets offer higher growth potential
Smart International Allocation Strategy:
Conservative Approach (30% International):
- 20% Developed International: EAFE index funds
- 10% Emerging Markets: Broad emerging market funds
Moderate Approach (40% International):
- 25% Developed International: Mix of regional funds
- 15% Emerging Markets: Include small-cap exposure
Aggressive Approach (50% International):
- 30% Developed International: Individual country funds
- 20% Emerging Markets: Sector-specific and country-specific funds
Implementation Methods:
ETF Approach (Simple):
- VTI: Total U.S. stock market (50%)
- VTIAX: Total international stock market (50%)
- Done: Global diversification achieved
Regional Approach (Moderate Complexity):
- VTI: U.S. stocks (50%)
- VEA: Developed markets (30%)
- VWO: Emerging markets (20%)
Individual Stock Approach (High Complexity):
- Research individual companies in target countries
- Consider ADRs (American Depositary Receipts) for easier trading
- Focus on multinational leaders with global competitive advantages
Timing Your International Allocation:
Dollar Strength Periods: International stocks may lag, good accumulation time Dollar Weakness Periods: International stocks may outperform, consider rebalancing Market Cycle Timing: Emerging markets often lead global recoveries
Real Performance Comparison (2015-2025):
U.S. Stocks (S&P 500): +180% total return
International Developed: +95% total return
Emerging Markets: +85% total return
But consider: U.S. started from much lower valuations in 2015. Future 10 years may favor international markets starting from current valuations.
Action Steps:
- Calculate your current international allocation
- Start with broad international index funds (VTIAX, VEA, VWO)
- Gradually increase allocation over 6-12 months
- Rebalance annually to maintain target allocation
- Stay disciplined during periods of underperformance
Think About This: The next Amazon, Apple, or Microsoft might be trading in Shanghai, Tokyo, or Frankfurt right now at half the price of similar U.S. companies. Are you looking globally for opportunities?
Expand your investment universe with StockSageAI's comprehensive international screening and analysis tools. Our platform covers US, Indian, and European markets with unified screening criteria, currency-adjusted analysis, and cross-market valuation comparisons. Access international stock screening, regional allocation tools, and global portfolio optimization features. Break free from home country bias and discover worldwide opportunities at StockSageAI.com.