The Earnings Growth Engine - Why 12% Growth Isn't What It Seems
Decode the truth behind 2025's "record" 12% earnings growth and discover why Magnificent 7 companies drive 29.8% growth while everyone else manages just 6.6%. Learn to distinguish sustainable growth from accounting tricks and inflation.
Companies are reporting "record earnings growth" of 12% in 2025, but smart investors know this number hides a dangerous secret that could crash the party.
The Story: Restaurant owner Maria announces: "We increased sales by 50% this year!" Sounds impressive, right? But dig deeper: she raised prices by 45% and only sold 5% more meals. Is this real growth or just inflation in disguise?
The Market's Growth Mirage: S&P 500 Earnings Growth (2025 forecast): 12.6% Reality check needed: How much is real growth vs. price increases?
The Growth Breakdown: Magnificent 7 Companies: 29.8% earnings growth (the superstars) Everyone Else: 6.6% earnings growth (the reality)
This means: Without Apple, Microsoft, Google, Amazon, Tesla, Meta, and Nvidia, the market would be growing at recession-like levels.
Earnings Growth Quality Check:
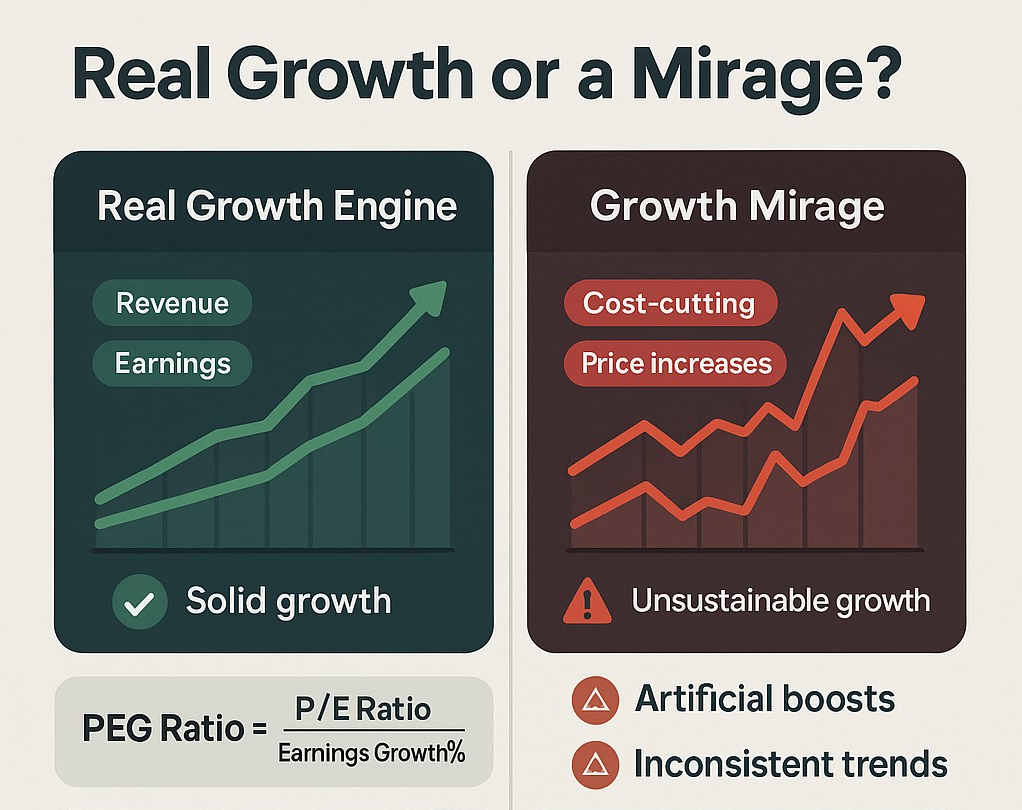
High-Quality Growth (Buy Signal):
✅ Revenue growth > earnings growth: Expanding margins
✅ Volume growth > price growth: Real demand increasing
✅ Consistent across quarters: Not one-time events
✅ Investing in future: R&D and capex increasing
Low-Quality Growth (Warning Signal):
❌ Earnings growth > revenue growth: Unsustainable cost-cutting
❌ Price increases driving everything: Inflation, not demand
❌ One-time gains: Accounting tricks or asset sales
❌ Cutting investments: Borrowing from future growth
Real Company Examples:
Microsoft (High-Quality Growth):
- Revenue growth: 15% (strong demand for cloud services)
- Earnings growth: 20% (improving efficiency + pricing power)
- Investment: $10B+ in AI infrastructure
- Verdict: Real, sustainable growth
Generic Consumer Staples Company (Low-Quality):
- Revenue growth: 3% (mostly price increases)
- Earnings growth: 8% (supply chain cost-cutting)
- Investment: Declining R&D spending
- Verdict: Borrowed time growth
The Growth Rate Spectrum:
Recession Territory (0-5% growth):
- Typically means economic trouble
- Only accept from mature, dividend-paying companies
- Focus on stability over growth
Slow Growth (5-10% growth):
- Normal for large, mature companies
- Acceptable if consistent and sustainable
- Look for dividend increases
Solid Growth (10-15% growth):
- Sweet spot for most investments
- Sustainable for quality companies
- Balance of growth and stability
High Growth (15-25% growth):
- Exciting but requires scrutiny
- Make sure it's sustainable
- Often comes with higher valuations
Explosive Growth (25%+ growth):
- Usually temporary or unsustainable
- Could signal early-stage disruptor
- High risk, high reward territory
Current Market Growth Reality: 2025 Sector Growth Rates:
- Technology: 18.5% (AI boom driving demand)
- Communication Services: 14.2% (digital advertising recovery)
- Healthcare: 11.8% (aging population trends)
- Financials: 8.9% (interest rate environment)
- Energy: 5.1% (commodity price stabilization)
- Utilities: 3.2% (mature, regulated industry)
The Growth Sustainability Test: Ask these questions about any company's growth:
- Can they repeat this performance next year?
- Are they gaining market share or just raising prices?
- Are competitors achieving similar growth?
- What happens when the economy slows?
Growth vs. Value Pricing: Fair Price for Growth Formula:
- 10% growth = 15-20 P/E ratio
- 15% growth = 20-25 P/E ratio
- 20% growth = 25-30 P/E ratio
- 25%+ growth = 30+ P/E ratio (proceed with caution)
Red Flags in Growth Reporting:
- Adjusted earnings vs. GAAP earnings (big differences)
- One-time gains inflating numbers
- Acquisition-driven growth (buying growth, not growing organically)
- Currency manipulation (international companies)
Smart Growth Investing Strategy:
- Focus on revenue growth first - it's harder to manipulate
- Look for margin expansion - sign of operational efficiency
- Check free cash flow growth - real money generation
- Verify market share gains - sustainable competitive advantage
Growth at Reasonable Price (GARP): The smartest investors combine growth and value:
- Target: 15% earnings growth at 20 P/E ratio
- PEG Ratio: 1.0 or below (P/E divided by growth rate)
- Quality: Strong balance sheet and competitive moats
Action Steps:
- Calculate PEG ratios for your growth holdings
- Verify revenue vs. earnings growth in quarterly reports
- Check management guidance for future growth sustainability
- Compare growth rates to industry and historical averages
Think About This: A company growing earnings by cutting costs is like a restaurant increasing profits by serving smaller portions - it works until customers find better alternatives.
Identify genuine earnings growth with StockSageAI's comprehensive earnings analysis tools. Our platform tracks revenue vs. earnings growth, analyzes margin trends, screens for sustainable growth companies, and calculates PEG ratios across global markets. Access forward earnings estimates, growth sustainability metrics, and quality growth screening to avoid earnings manipulation traps. Discover companies with real, lasting growth potential at StockSageAI.com.