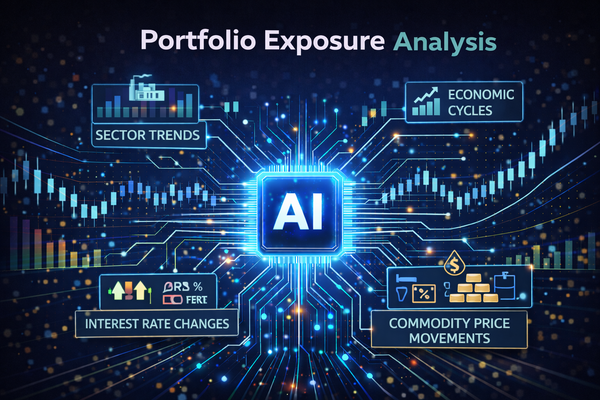
The Beta Test: Measuring Your Stock’s Wild Side
Your friend owns two cars: a steady Honda Civic and a thrilling Ferrari. When gas prices spike, guess which one hurts their wallet more…
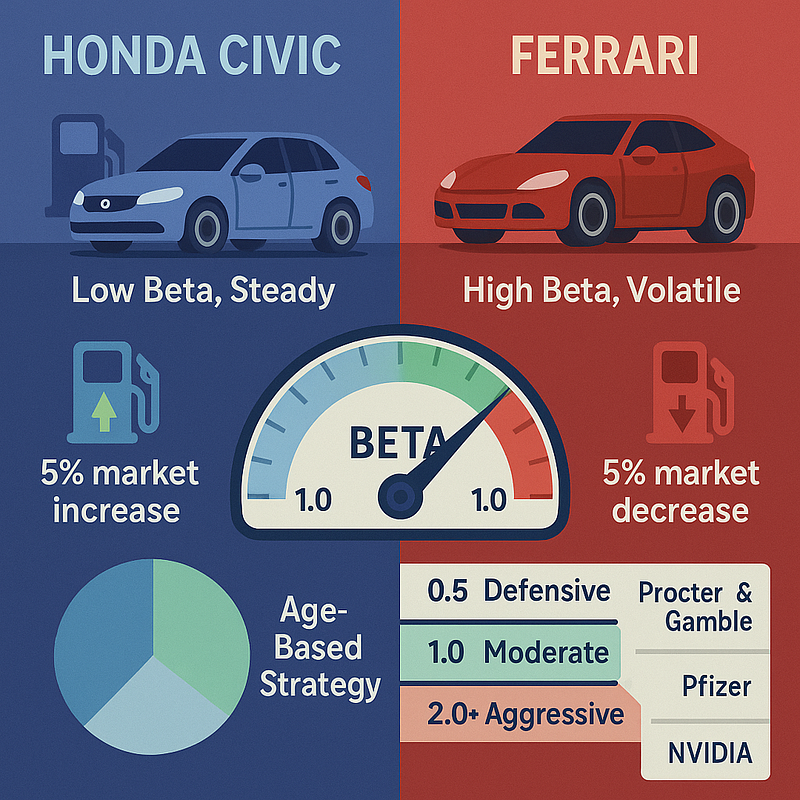
Your friend owns two cars: a steady Honda Civic and a thrilling Ferrari. When gas prices spike, guess which one hurts their wallet more? Beta measures the same thing for stocks.
The Honda Civic (Low Beta Stock):
- Gas prices up 20% → Civic owner’s costs up 10%
- Gas prices down 20% → Civic owner’s costs down 10%
- Reaction: Steady, predictable response
The Ferrari (High Beta Stock):
- Gas prices up 20% → Ferrari owner’s costs up 40%
- Gas prices down 20% → Ferrari owner’s costs down 40%
- Reaction: Amplified, volatile response
Beta in the Stock Market: Beta measures how much a stock moves relative to the overall market.
Beta = 1.0: Moves exactly with the market
- Market up 10% → Stock up 10%
- Market down 10% → Stock down 10%
Beta > 1.0: More volatile than market
- Tesla (Beta 2.3): When market moves 10%, Tesla typically moves 23%
- High-beta stocks: Tech, growth, speculative companies
Beta < 1.0: Less volatile than market
- Walmart (Beta 0.5): When market moves 10%, Walmart moves 5%
- Low-beta stocks: Utilities, consumer staples, bonds
Real Beta Examples:
Wild Ride Stocks (High Beta):
- Zoom (Beta 1.8): Pandemic darling, extreme swings
- Peloton (Beta 1.9): Home fitness boom and bust
- Cryptocurrency stocks (Beta 2.0+): Amplify market movements
Steady Eddie Stocks (Low Beta):
- Procter & Gamble (Beta 0.4): People always need soap
- Berkshire Hathaway (Beta 0.8): Diversified, stable
- Utilities (Beta 0.3–0.7): Regulated, predictable
The Beta Strategy Guide:
Young Investors (20s-30s):
- Can handle higher beta (1.2–1.8)
- Time to recover from volatility
- Seeking growth over stability
Middle-aged Investors (40s-50s):
- Moderate beta (0.8–1.2)
- Balance growth with stability
- Less time for major recovery
Near Retirement (60s+):
- Lower beta (0.5–0.8)
- Preservation over growth
- Need predictable returns
Beta Misconceptions:
❌ Myth: Low beta means low returns
✅ Reality: Low beta means steadier path to returns
❌ Myth: High beta guarantees high returns
✅ Reality: High beta means bigger swings (up AND down)
The Portfolio Beta Calculation: If you own:
- 50% S&P 500 ETF (Beta 1.0)
- 30% Tech stocks (Beta 1.5)
- 20% Utility stocks (Beta 0.6)
Portfolio Beta: (0.5 × 1.0) + (0.3 × 1.5) + (0.2 × 0.6) = 1.07
Action Step: Calculate your portfolio’s beta. If it’s above 1.3, prepare for a wild ride. Below 0.7? You’re in the slow lane (which might be perfect for you).
Think About This: Do you want to drive a Ferrari or a Honda Civic with your life savings? Beta helps you choose the right investment “vehicle” for your journey.