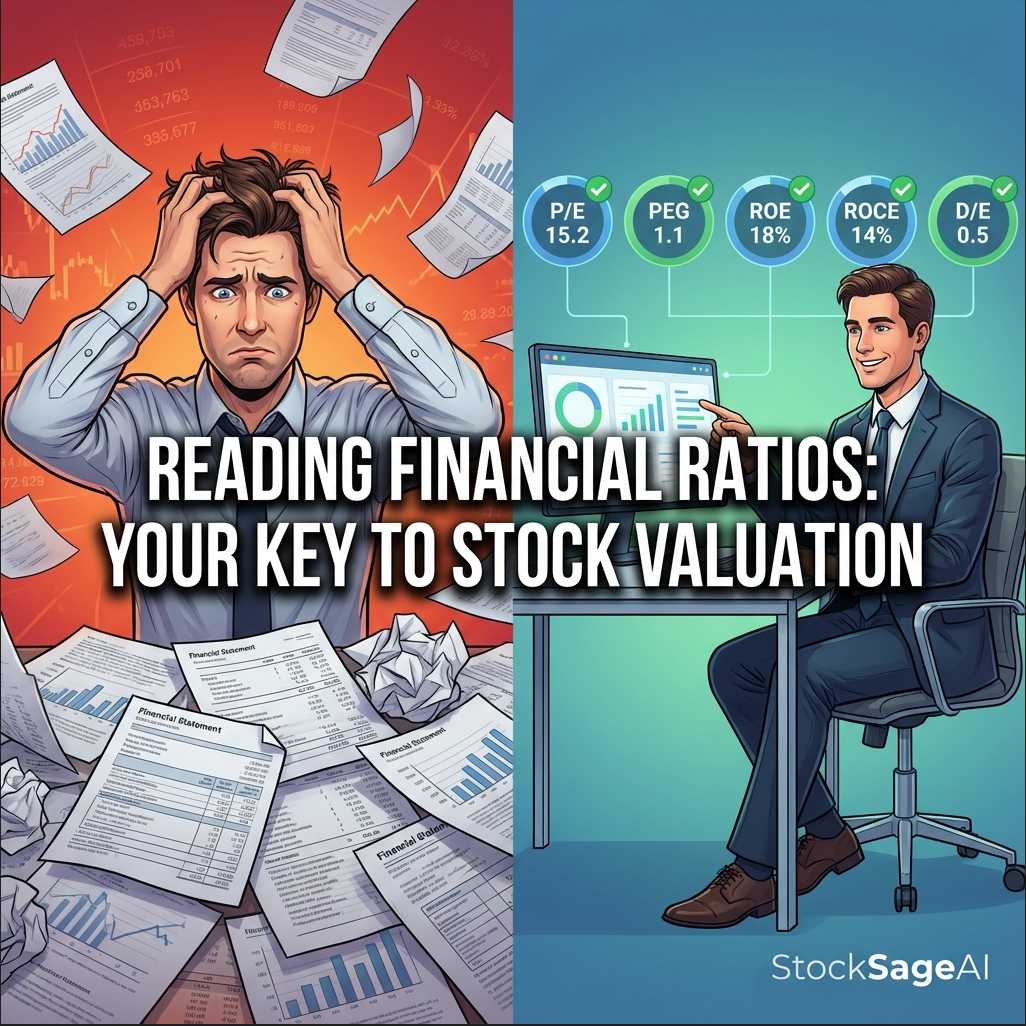
Reading Financial Ratios: Your Key to Stock Valuation
Financial ratios decode company health in minutes. Learn how P/E, PEG, ROE, ROCE, and D/E ratios reveal value that balance sheets hide from casual investors.
The Story: When Numbers Told the Truth That Words Concealed
Meet Neha, a 35-year-old consultant who fell in love with a stock story. The company? A flashy electric vehicle startup with celebrity endorsements, viral marketing, and a charismatic CEO promising to "revolutionize Indian transportation."
The Compelling Narrative:
- Media: "The Tesla of India!"
- Analyst upgrades: "Strong Buy"
- Price momentum: +180% in 6 months
- Social media: Trending #NextBigThing
Neha invested ₹3 lakhs at ₹850 per share in March 2022, convinced she was early to the next multi-bagger.
But a 5-minute ratio analysis would have revealed the disaster hiding in plain sight:
| Ratio | Company | Industry Avg | Red Flag? |
|---|---|---|---|
| P/E Ratio | 450 | 25 | ❌ Massive overvaluation |
| Debt-to-Equity | 3.8 | 0.8 | ❌ Dangerously leveraged |
| ROE | -12% | 15% | ❌ Losing money on equity |
| Current Ratio | 0.6 | 1.5 | ❌ Can't pay bills |
| Profit Margin | -35% | 8% | ❌ Burning cash |
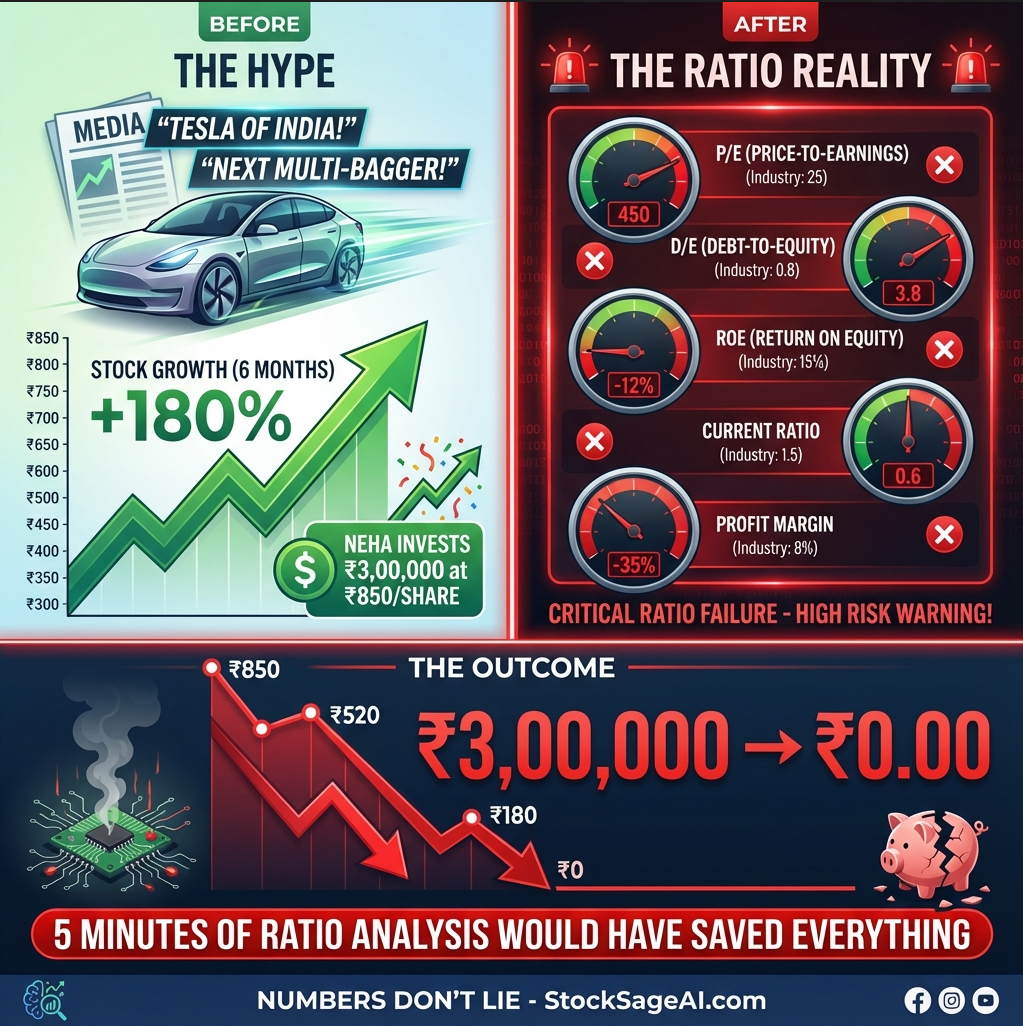
What happened next:
- June 2022: Stock at ₹520 (-39%)
- December 2022: Stock at ₹180 (-79%)
- March 2023: Company delisted, bankruptcy proceedings
- Neha's ₹3 lakhs became ₹0.00
Meanwhile, her friend Arjun—who religiously checked financial ratios—identified the red flags immediately and never bought in. He also found 3 genuinely undervalued companies using ratio screening that delivered +45%, +52%, and +38% returns over the same period.
The Brutal Truth: Research from CFA Institute shows that investors who use financial ratios outperform those who don't by 3-5% annually. Yet 70% of retail investors admit they never look at a company's financial statements before buying.
Financial ratios aren't complex calculus—they're the vital signs that reveal if a company is healthy or dying, regardless of what the marketing says.
The Sophisticated Medical Analogy: Your Company Health Checkup
Imagine you're meeting someone for the first time. They look healthy, dress well, speak confidently. Would you marry them based on appearance alone?
Of course not. You'd want to know:
- Medical history (past health issues)
- Current vitals (blood pressure, cholesterol, heart rate)
- Lifestyle habits (exercise, diet, stress levels)
- Genetic risks (family health history)
- Financial stability (can they support a family?)
Buying a stock without checking financial ratios is like marrying someone without a health checkup.
Financial ratios are your company's vital signs:
The Appearance (What You See):
- Flashy website and marketing
- CEO interviews on CNBC
- Trending on social media
- Rising stock price
The Vital Signs (What Ratios Reveal):
- P/E Ratio = Temperature (is valuation feverish or normal?)
- ROE/ROCE = Heart Health (is the business engine strong?)
- Debt-to-Equity = Cholesterol (is leverage clogging arteries?)
- Current Ratio = Blood Pressure (can it handle stress?)
- Profit Margins = Overall Fitness (efficient operations?)
The Critical Point: A person can look healthy but have dangerously high cholesterol. A company can have exciting growth stories but be hemorrhaging cash with unsustainable debt.
Dr. Aswath Damodaran (NYU finance professor, the "Dean of Valuation") states: "Price is what you pay; value is what you get. Ratios help you distinguish between the two."
The Five Critical Financial Ratios Every Investor Must Know
1. P/E Ratio (Price-to-Earnings): The Valuation Thermometer
Formula: Stock Price ÷ Earnings Per Share (EPS)
What It Tells You: How many years of current earnings you're paying for
Real Example:
- Company A: Stock price ₹1,000, EPS ₹50 → P/E = 20
- Company B: Stock price ₹1,000, EPS ₹25 → P/E = 40
Interpretation:
- Company A: You're paying 20 years of earnings
- Company B: You're paying 40 years of earnings (more expensive for same price)
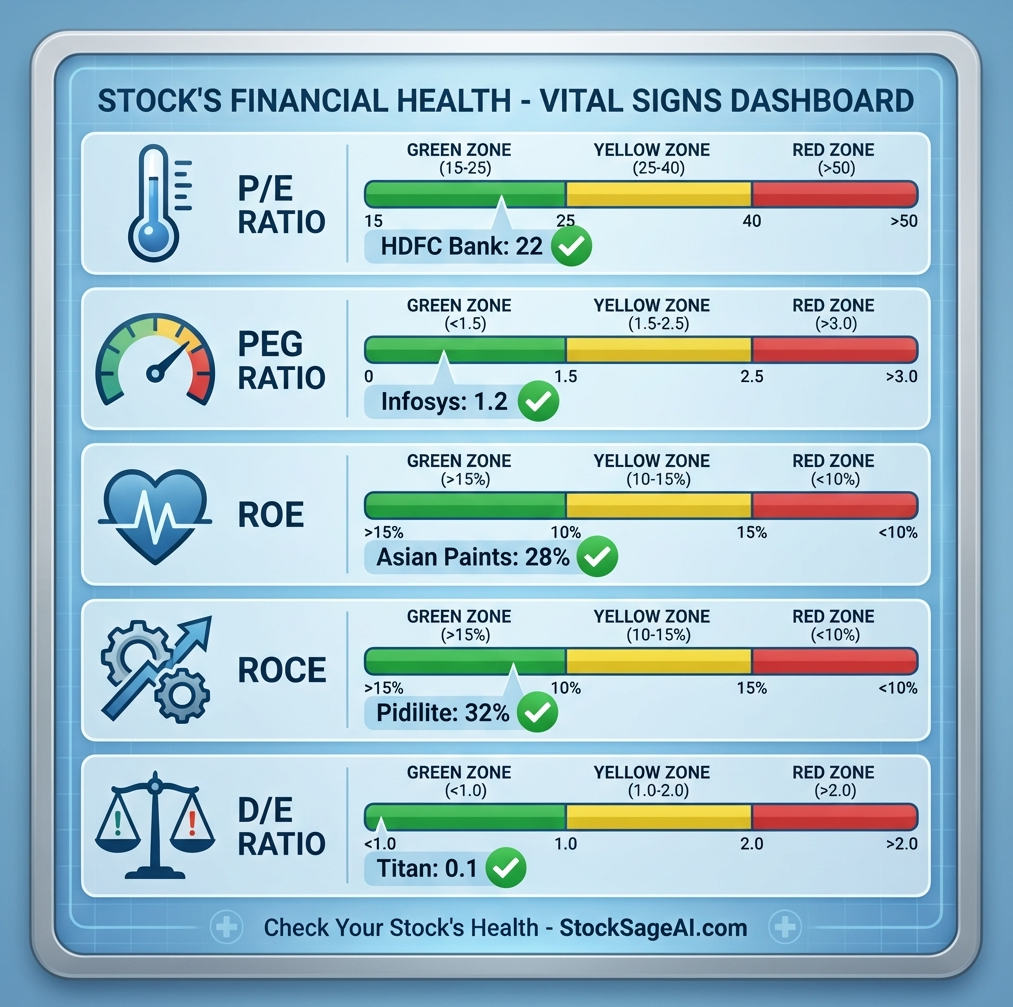
Indian Market Benchmarks (2024):
- Low P/E: <15 (potentially undervalued or troubled)
- Moderate P/E: 15-25 (fair valuation)
- High P/E: 25-35 (growth premium or overvalued)
- Very High P/E: >50 (extreme growth expectations or bubble)
When High P/E Is Justified:
- ✅ Consistent 25%+ earnings growth (IT services golden era: Infosys 2000-2007)
- ✅ Market leadership + strong moats (Asian Paints, HDFC Bank)
- ✅ Disruptive technology with proven revenue model
Red Flags:
- ❌ High P/E + declining earnings (value trap)
- ❌ P/E >3x industry average without justification
- ❌ Negative earnings but positive P/E (nonsensical valuation)
Real Case:
- Yes Bank (2018): P/E of 18 looked reasonable
- Hidden issue: Earnings quality was poor (bad loans not fully recognized)
- Outcome: Stock crashed 95% as real earnings emerged
Key Lesson: Always compare P/E to industry peers and historical average, not in isolation.
2. PEG Ratio (Price/Earnings-to-Growth): The Growth-Adjusted Value Meter
Formula: P/E Ratio ÷ Earnings Growth Rate (%)
What It Tells You: Whether you're overpaying for growth
Real Example:
- Company A: P/E 30, Growth 30% → PEG = 1.0 (fair)
- Company B: P/E 30, Growth 10% → PEG = 3.0 (expensive)
- Company C: P/E 15, Growth 20% → PEG = 0.75 (undervalued)
The Peter Lynch Rule:
- PEG < 1.0: Undervalued relative to growth (buy signal)
- PEG = 1.0-1.5: Fairly valued
- PEG > 2.0: Overpaying for growth (caution)
Why PEG Beats P/E Alone:
A P/E of 40 sounds expensive, but:
- If growth is 50%/year → PEG = 0.8 (bargain!)
- If growth is 10%/year → PEG = 4.0 (trap!)
Real Example - HDFC Bank Evolution:
- 2010: P/E 25, Growth 25% → PEG 1.0 (fairly valued)
- 2015: P/E 28, Growth 18% → PEG 1.56 (slightly expensive)
- 2020: P/E 22, Growth 15% → PEG 1.47 (reasonable)
Investors who bought when PEG was <1.2 outperformed significantly.
Warning: PEG only works if growth is sustainable. One-time growth spikes distort the ratio.
3. ROE (Return on Equity): The Profitability Powerhouse
Formula: Net Income ÷ Shareholder Equity × 100
What It Tells You: How efficiently the company generates profit from shareholder money
Think of it as: If you gave a business ₹100, how much annual profit does it return?
ROE Benchmarks:
- <10%: Weak (FD rates are better!)
- 10-15%: Average
- 15-20%: Good
- 20-25%: Excellent
- >25%: Outstanding (sustainable competitive advantage)
Real Examples (Indian Markets 2023):
- Asian Paints: ROE 28% (pricing power + brand moat)
- HDFC Bank: ROE 17% (efficient capital deployment)
- Tata Steel: ROE 8% (capital-intensive, commodity business)
The Warren Buffett Test: Buffett seeks companies with ROE >15% sustained over 10+ years. This indicates durable competitive advantage.
Red Flags to Watch:
- ❌ High ROE + High Debt: May be financially engineered (inflated by leverage, risky)
- ❌ Declining ROE Trend: Competitive advantage eroding
- ❌ ROE < Cost of Equity: Destroying shareholder value
Advanced Tip: Compare ROE to industry median. A pharma company with 18% ROE might be average, but a steel company with 18% is exceptional.
4. ROCE (Return on Capital Employed): The Business Efficiency Judge
Formula: EBIT ÷ Capital Employed × 100
Capital Employed = Total Assets - Current Liabilities
What It Tells You: How well the company uses ALL capital (equity + debt) to generate profit
Why ROCE > ROE for Some Analysis:
- ROE ignores debt (can be manipulated by leverage)
- ROCE shows true operational efficiency
- Better for comparing companies with different capital structures
ROCE Benchmarks:
- <10%: Poor capital efficiency
- 10-15%: Acceptable
- 15-20%: Good
- >20%: Excellent
Real Comparison:
| Company | ROE | ROCE | Interpretation |
|---|---|---|---|
| A | 25% | 22% | High debt, but efficiently used |
| B | 25% | 12% | Debt-fueled ROE (risky!) |
| C | 18% | 18% | Low debt, pure operational excellence |
Company C is the safest bet despite lower ROE—it's not relying on leverage tricks.
Real Example - Pidilite Industries:
- Consistent ROCE >30% for 15+ years
- Low debt, high return = quality compounding machine
- Stock delivered 25%+ CAGR over long term
Key Insight: If ROCE > Cost of Capital (typically 10-12%), the company creates value. If ROCE < Cost of Capital, it destroys value.
5. Debt-to-Equity Ratio: The Financial Risk Thermometer
Formula: Total Debt ÷ Shareholder Equity
What It Tells You: How much leverage (borrowed money) the company uses
Interpretation:
- 0-0.5: Conservative (low debt, safe but maybe under-leveraged)
- 0.5-1.0: Moderate (healthy balance)
- 1.0-2.0: Aggressive (watchable, sector-dependent)
- >2.0: Dangerous (high bankruptcy risk in downturns)
Industry Variations Matter:
- Capital-light (IT, Pharma): D/E should be <0.5
- Infrastructure (Power, Roads): D/E of 1.5-2.0 might be normal
- Banks: Use different metric (don't compare to others)
Real Disaster - IL&FS Collapse (2018):
- Debt-to-Equity: 12.0 (insanely leveraged)
- Market reaction: "Infrastructure company, it's normal"
- Reality: Couldn't service debt → default → stock to ₹0
Meanwhile - Titan Company:
- Debt-to-Equity: 0.1 (almost debt-free)
- Result: Weathered every crisis, compounded steadily
Red Flags:
- ❌ Rising D/E trend: Taking more debt without growth
- ❌ High D/E + Low ROE: Borrowing money but not generating returns
- ❌ High D/E + Cyclical industry: Disaster waiting in downturn
Golden Rule: High returns with low debt beats high returns with high debt, every time.
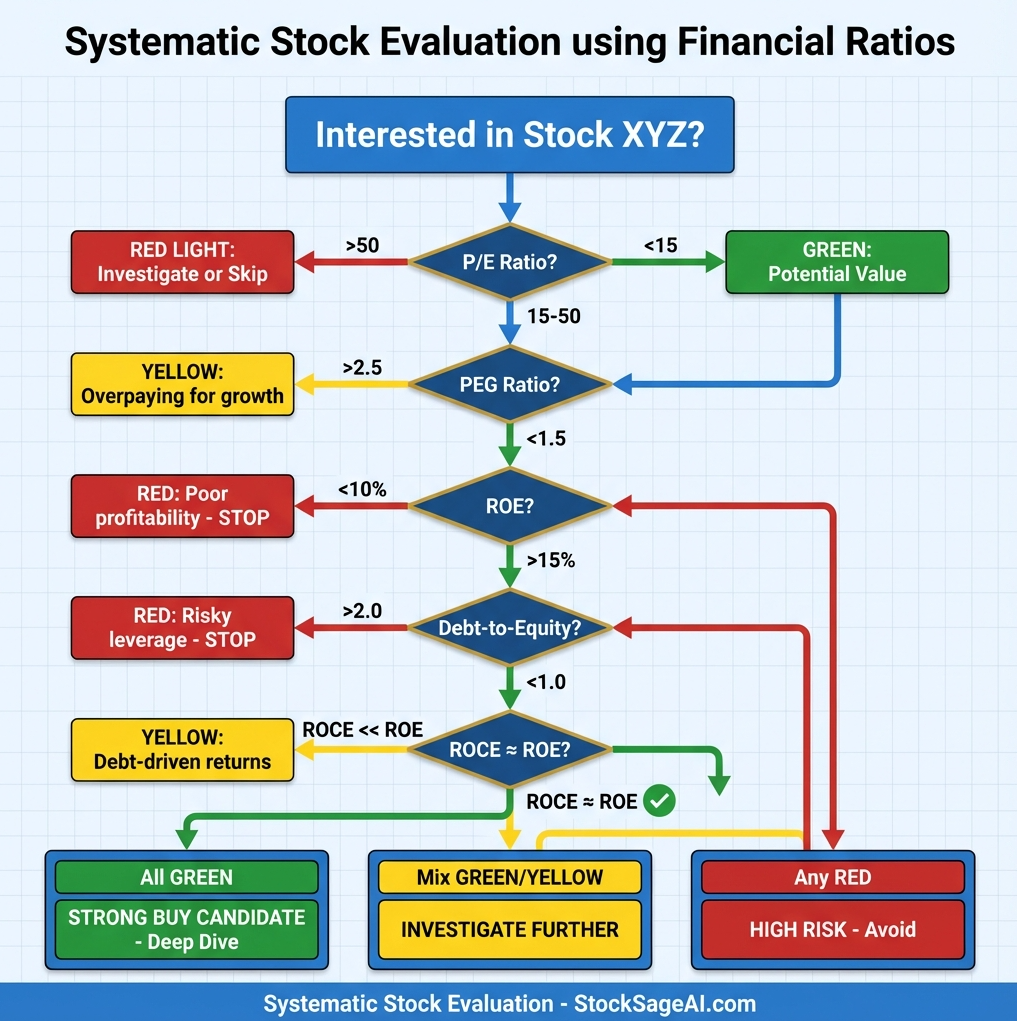
Putting It All Together: The Ratio Checklist
Green Company (Quality Buy):
- ✅ P/E: 15-25 (reasonable valuation)
- ✅ PEG: <1.5 (not overpaying for growth)
- ✅ ROE: >15% sustained 5+ years
- ✅ ROCE: >15% and close to ROE
- ✅ D/E: <1.0 for most sectors
🟡 Yellow Company (Investigate Further):
- ⚠️ P/E: 25-40 (growth stock or overvalued?)
- ⚠️ PEG: 1.5-2.5 (paying premium, is it justified?)
- ⚠️ ROE: 10-15% (mediocre, competitive?)
- ⚠️ D/E: 1.0-2.0 (manageable but watch closely)
🔴 Red Company (Avoid or Sell):
- ❌ P/E: >50 with slowing growth
- ❌ PEG: >3.0
- ❌ ROE: <10% or declining
- ❌ ROCE: <10%
- ❌ D/E: >2.5
Professional Insights: Advanced Ratio Usage
✅ Compare Across Time, Not Just Snapshot
Don't just check today's ratios—look at 5-year trends:
- Is ROE improving or deteriorating?
- Is debt rising faster than equity?
- Is P/E expanding beyond historical range?
Example: A company with ROE improving from 12% → 18% over 5 years shows strengthening competitive position.
✅ Industry Context Is Everything
| Sector | Typical P/E | Typical D/E | Typical ROE |
|---|---|---|---|
| IT Services | 20-30 | 0-0.3 | 20-30% |
| Banking | 12-18 | N/A | 12-18% |
| Auto | 15-25 | 0.5-1.5 | 12-18% |
| Pharma | 25-40 | 0-0.5 | 15-25% |
| Infrastructure | 10-15 | 1.5-3.0 | 8-15% |
A pharma company at P/E 30 is normal. A steel company at P/E 30 is extreme.
✅ Use Ratios to Screen, Then Deep-Dive
Step 1: Screen for quantitative quality
- ROE >15%, ROCE >15%, D/E <1.0, P/E <25
Step 2: Investigate qualitative factors
- Management quality
- Competitive moat
- Industry tailwinds
- Growth runway
Ratios get you the shortlist. Due diligence gets you the conviction.
✅ Combine Multiple Ratios for Clarity
Single Ratio = Misleading
- High ROE could be debt-fueled (check D/E)
- Low P/E could be value trap (check ROE trend)
- High growth could be unsustainable (check profit margins)
Multiple Ratios = Clarity
- High ROE + Low D/E + Moderate P/E = Quality compounder
- High P/E + High PEG + Negative ROE = Speculation bubble
✅ Watch for Earnings Quality
Not all earnings are created equal:
- Cash-backed earnings > Accounting earnings
- Recurring revenue > One-time gains
- Operating profit > Financial engineering
Check: Free Cash Flow vs Net Income. If FCF << Net Income, earnings quality is poor.
How StockSageAI Automates Ratio Analysis
Instant Multi-Ratio Screening: StockSageAI's platform analyzes thousands of companies across Indian, US, and European markets, screening by:
- Custom ratio combinations (e.g., "ROE >20%, D/E <0.5, PEG <1.5")
- Peer comparison tables showing how each stock ranks in its industry
- Historical trend charts for every ratio over 5-10 years
- Automated red flag alerts when ratios deteriorate
Visual Ratio Dashboards: See company health at a glance:
- Color-coded ratio cards (green/yellow/red based on benchmarks)
- Industry percentile rankings (is this company top 25%?)
- Trend arrows showing improving/stable/declining metrics
- Comparison charts vs sector median and top competitors
AI-Powered Ratio Interpretation: The platform explains what ratios mean in context:
- "P/E of 28 is 15% above 5-year average—potential overvaluation"
- "ROE improved from 14% to 19% over 3 years—strengthening fundamentals"
- "D/E ratio of 1.8 is high for IT sector (median 0.3)—investigate debt usage"
Automated Watchlist Monitoring: Get alerts when ratio thresholds are breached:
- ROE drops below 15%
- Debt-to-Equity exceeds 1.5
- P/E expands >50% above historical average
- PEG ratio moves above 2.0
Action Steps to Master Financial Ratios
- Open any stock's annual report - Find the key metrics in 5 minutes
- Calculate the 5 ratios for your current holdings
- Compare to industry benchmarks - Are you holding quality or junk?
- Set screening criteria - ROE >15%, D/E <1.0, PEG <2.0
- Review quarterly - Track trends, not just snapshots
- Practice on failed stocks - Reverse-engineer what ratios predicted disaster
Never buy a stock blindly again with StockSageAI's comprehensive ratio analysis platform. Our AI engine automatically calculates and monitors P/E, PEG, ROE, ROCE, Debt-to-Equity, and 30+ additional financial metrics across thousands of global stocks. Access color-coded ratio dashboards, peer comparison tables, 10-year historical trends, and automated deterioration alerts that professional analysts use. Join thousands of informed investors who've avoided costly mistakes like Neha's by letting data guide decisions instead of hype. Screen stocks by multiple ratio criteria, get AI-powered interpretations, and track ratio changes in real-time at StockSageAI.com. Because 5 minutes of ratio analysis can save years of regret.