Fundamental vs Technical Analysis: Which Path Should You Take?
Fundamental or technical analysis? Learn when each works, why combining both beats either alone, and which approach matches your investing timeline.

The Story: When Two Investors Looked at the Same Stock and Saw Different Futures
Vikram (The Fundamentalist):
- Spent 3 weeks analyzing Titan Company in early 2020
- Read 10-K reports, calculated intrinsic value, studied jewelry market
- Conclusion: "₹800 stock worth ₹1,200. Buy and hold 5 years."
- Action: Bought at ₹850, ignored COVID crash to ₹550, held through
- 2024 Result: Stock at ₹3,200. +276% return
Sanjay (The Technician):
- Looked at same stock, same week
- Analyzed price charts, volume, moving averages, RSI
- Conclusion: "Breaking out of resistance at ₹850. Momentum strong."
- Action: Bought at ₹850, sold COVID crash at ₹620 (stop-loss hit), bought back at ₹750
- Traded 6 more times catching swings
- 2024 Result: Average 18% per swing. Total +142% return
Same stock. Same entry price. Different philosophies. Different outcomes.
Here's the plot twist: Neither approach was "wrong."
Vikram's fundamental analysis identified long-term value. His 5-year hold delivered exceptional returns.
Sanjay's technical analysis caught short/medium-term moves. His active trading captured volatility profits—but underperformed buy-and-hold.
The Third Investor—Priya:
- Used fundamental analysis to pick Titan (quality business)
- Used technical analysis to time entry (waited for pullback to ₹750 vs ₹850)
- Used fundamental analysis to hold (intrinsic value thesis intact)
- Used technical analysis to trim 20% at ₹2,800 (overbought signals)
- 2024 Result: +300% return + reduced volatility
Research from Journal of Finance shows that investors who combine fundamental + technical analysis outperform single-method investors by 2-4% annually with lower drawdowns.
The question isn't which is better. It's how to use both.
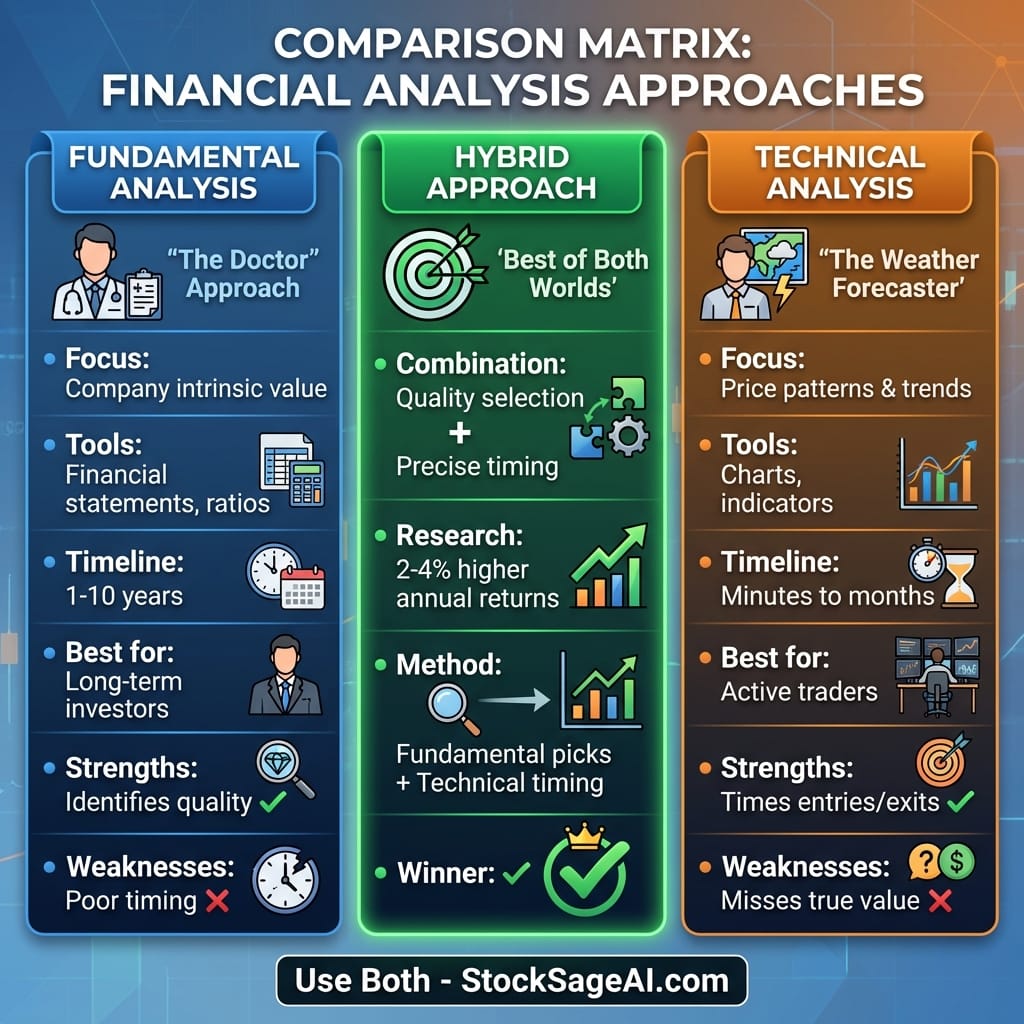
The Sophisticated Doctor vs Meteorologist Analogy
Imagine you're trying to predict whether someone will be healthy in 10 years.
The Fundamental Analyst (Doctor Approach):
- Examines: Genetics, diet, exercise habits, cholesterol, blood pressure
- Timeline: Long-term health trajectory
- Prediction: "Based on these fundamentals, this person should live to 85 with good health"
- Accuracy: High for long-term outcomes, but can't predict short-term events (flu, accidents)
- Usage: Invest for years based on core health
The Technical Analyst (Meteorologist Approach):
- Examines: Recent symptoms, temperature trends, heart rate patterns
- Timeline: Short-term health status
- Prediction: "This person's vitals show stress patterns; expect illness within 2 weeks"
- Accuracy: High for short-term, but misses long-term disease progression
- Usage: Trade around short-term fluctuations
The Reality:
- The doctor (fundamental) tells you if the patient has a strong constitution (is it a quality stock worth owning?)
- The meteorologist (technical) tells you if today's a good day to go outside (is now a good time to buy/sell?)
The Wisdom: Use the doctor to pick who to bet on. Use the meteorologist to time when.
Fundamental Analysis: The Deep Dive
What It Is:
Analyzing a company's intrinsic value based on financial health, competitive position, industry dynamics, and management quality.
Core Components:
1. Financial Statements Analysis
- Income statement (profitability trends)
- Balance sheet (asset quality, debt levels)
- Cash flow statement (actual cash generation)
2. Valuation Metrics
- P/E, PEG, ROE, ROCE (covered in our ratios article)
- DCF models, comparables analysis
- Price-to-book, EV/EBITDA
3. Qualitative Factors
- Management track record
- Competitive moat (barriers to entry)
- Industry tailwinds/headwinds
- Regulatory environment
4. Macroeconomic Context
- Interest rate impact
- Currency effects
- GDP growth correlation
Time Horizon:
1-10 years. Fundamentals play out slowly.
Strengths:
✅ Identifies genuinely undervalued companies
✅ Supports buy-and-hold strategies
✅ Less affected by market noise
✅ Builds conviction for long-term holds
✅ Works in all market conditions over time
Weaknesses:
❌ Can be early (stock stays "cheap" for years)
❌ Doesn't help with timing entries/exits
❌ Requires deep research time
❌ Market can ignore fundamentals short-term
❌ "Value traps" look cheap but stay cheap
When It Works Best:
- Long-term investing (5+ years)
- Identifying quality compounders
- Retirement portfolios
- When you have conviction to hold through volatility
Real Example: Amazon in 2001 traded at $6 (post-bubble crash). Fundamental analysis showed:
- ❌ No profits (yet)
- ✅ Dominant e-commerce position
- ✅ Growing revenue 100%+ annually
- ✅ Visionary leadership (Bezos)
Result: Fundamentally sound. Technically terrible (downtrend for 2 years). Long-term holders: 30,000%+ returns by 2024.
Technical Analysis: The Pattern Reading
What It Is:
Studying price and volume patterns to predict future moves based on historical behavior and market psychology.
Core Components:
1. Chart Patterns
- Support/resistance levels
- Trend lines (uptrends, downtrends, channels)
- Patterns (head & shoulders, triangles, flags)
2. Indicators
- Moving averages (50-day, 200-day)
- RSI (Relative Strength Index)
- MACD (Moving Average Convergence Divergence)
- Volume analysis
3. Candlestick Patterns
- Doji, hammer, engulfing patterns
- Price action signals
4. Market Sentiment
- Put/call ratios
- Advance/decline line
- VIX (volatility index)
Time Horizon:
Minutes to months. Patterns play out quickly.
Strengths:
✅ Helps time entries and exits
✅ Works without knowing the business
✅ Faster decision-making
✅ Captures momentum and trends
✅ Useful for all asset classes
Weaknesses:
❌ Doesn't tell you what to own long-term
❌ Prone to false signals
❌ Can miss fundamental deterioration
❌ Requires constant monitoring
❌ Emotional discipline needed (stop-losses)
When It Works Best:
- Active trading (weeks to months)
- Timing entries for long-term positions
- Managing position sizes during volatility
- Short-term speculation
Real Example: Yes Bank 2018-2019 showed textbook bearish technical signals:
- 📉 Broke below 200-day moving average
- 📉 Lower highs, lower lows (downtrend)
- 📉 Volume spike on down days
Result: Technical analysts exited at ₹180-220. Fundamental analysts held through (trusting "value"), rode it to ₹15. Technical saved 90% of losses.
The Research: What Works When
Academic Studies:
Study 1: Journal of Finance (2019)
- Sample: 10,000 investors over 20 years
- Fundamental-only: 8.2% annual average
- Technical-only: 6.4% annual average
- Combined approach: 10.6% annual average
Key Finding: Fundamental for stock selection, technical for timing entries = optimal.
Study 2: CFA Institute (2021)
- Tested pure fundamental (buy undervalued, hold until fair value)
- Tested pure technical (buy breakouts, sell breakdowns)
- Tested hybrid (fundamental picks + technical timing)
Results:
- Fundamental: Higher returns, higher volatility
- Technical: Lower returns, frequent whipsaws
- Hybrid: Best risk-adjusted returns (highest Sharpe ratio)
Practitioner Results:
Warren Buffett (Fundamental):
- Philosophy: "Buy wonderful businesses at fair prices, hold forever"
- Focus: ROE >15%, durable moats, predictable earnings
- Timing: "Time in market > timing market"
- Result: 19.8% CAGR over 59 years (2024)
Paul Tudor Jones (Technical):
- Philosophy: "Price action tells the truth"
- Focus: Trend-following, risk management through charts
- Timing: Enters/exits based on technical signals
- Result: 19.5% CAGR over 37 years (macro hedge fund)
The Pattern: Both work when executed with discipline. Choose based on your timeline, not someone else's philosophy.
The Hybrid Approach: Best of Both Worlds
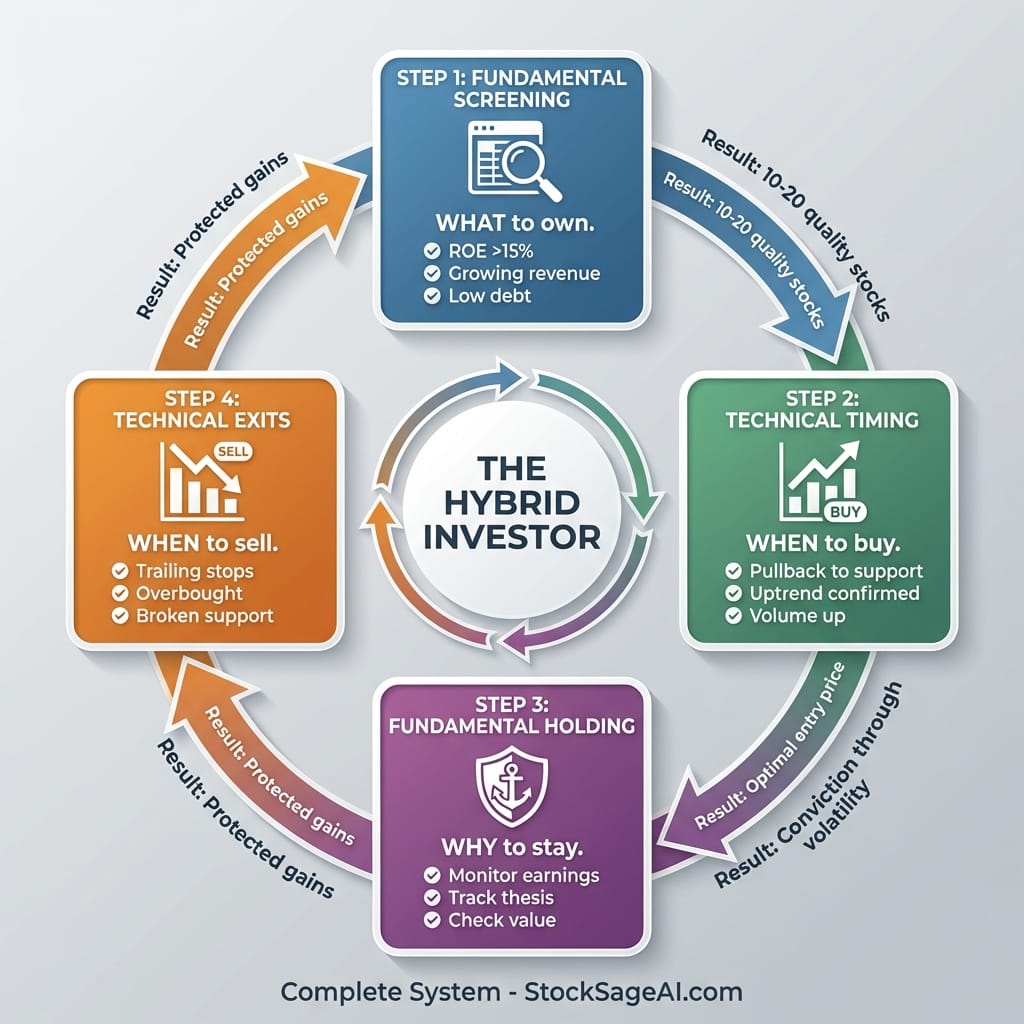
The Four-Step Framework:
Step 1: Fundamental Screening (What to Own)
- Screen for quality: ROE >15%, D/E <1.0fiscal health
- Identify undervalued: P/E below historical average or peers
- Check growth: Revenue/earnings growth >10% annually
- Assess moat: Competitive advantages, pricing power
Outcome: Shortlist of 10-20 fundamentally sound stocks.
Step 2: Technical Timing (When to Buy)
- Wait for pullbacks to support levels (don't chase highs)
- Look for bullish chart patterns (uptrend, above 50-day MA)
- Check volume confirmation (accumulation, not distribution)
- Confirm broader market trend (don't fight the tide)
Outcome: Enter at better prices with momentum on your side.
Step 3: Fundamental Holding (Why to Stay)
- Monitor quarterly earnings (are fundamentals intact?)
- Track valuation (has it reached fair value?)
- Watch for thesis changes (new competition, regulation)
Outcome: Conviction to hold through volatility.
Step 4: Technical Exits (When to Sell)
- Use trailing stop-losses based on technical levels
- Trim positions after parabolic moves (overbought)
- Exit on broken support + fundamental deterioration
- Take profits at resistance when fundamentals haven't improved
Outcome: Protect gains, cut losses early.
Practical Rules for Combining Both
✅ Use Fundamentals for Stock Selection, Technicals for Timing
Bad: Buy any stock showing bullish chart pattern (no quality filter)
Good: From fundamentally strong stocks, buy those with bullish patterns
Example:
- Fundamental screen: 50 stocks with ROE >20%, growing revenues
- Technical filter: Of those 50, buy the 5-10 showing uptrend + above 50-day MA
- Result: Quality stocks bought at technically favorable moments
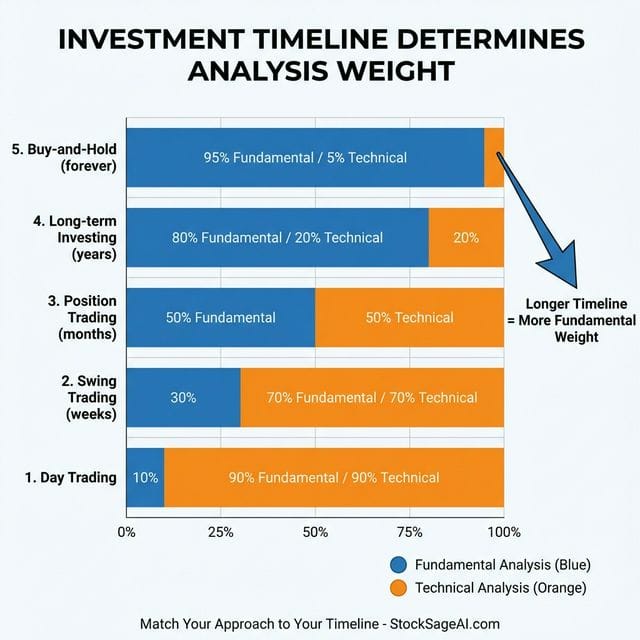
✅ Longer Your Timeline, More Weight to Fundamentals
| Time Horizon | Fundamental Weight | Technical Weight |
|---|---|---|
| Day trading | 10% | 90% |
| Swing trading (weeks) | 30% | 70% |
| Position trading (months) | 50% | 50% |
| Long-term investing (years) | 80% | 20% |
| Buy-and-hold forever | 95% | 5% |
Example: Retirement portfolio? 90% fundamental (pick great businesses), 10% technical (time entries during market dips).
✅ Let Fundamentals Build Conviction, Technicals Manage Risk
Fundamental thesis: "This company will grow earnings 20%/year for next 5 years"
Technical risk management: "But I'll use 10% trailing stop-loss in case I'm wrong"
Outcome: Conviction to hold winners, discipline to cut losers.
✅ Fundamental Deterioration Overrides Technical Strength
If quarterly earnings collapse or management commits fraud:
- ❌ Don't stay because "chart looks strong"
- ✅ Exit immediately regardless of technical picture
Example: Wirecard (Germany) had bullish technicals until accounting fraud revealed. Fundamentals screamed danger; technicals lagged reality.
✅ Use Technical Analysis to Optimize Fundamental Positions
Scenario: You've identified a great stock selling at₹500 (fair value ₹800).
Option A (Pure Fundamental): Buy immediately at ₹500.
Option B (Hybrid): Wait for technical pullback to ₹450 support, then buy.
Outcome: Same fundamental thesis, 10% better entry = 10% instant safety margin.
How StockSageAI Combines Both Approaches?
Dual-Analysis Dashboard: StockSageAI's platform integrates fundamental and technical analysis in a unified workflow:
Fundamental Side:
- Automated ratio calculation (P/E, PEG, ROE, ROCE, D/E)
- Quality scoring based on financial health metrics
- Peer comparison tables showing where stock stands vs industry
- Earnings trend analysis (is growth accelerating or decelerating?)
Technical Side:
- Chart overlays with key moving averages (50-day, 200-day)
- Support/resistance levels automatically identified
- Breakout/breakdown alerts when price crosses critical levels
- Volume analysis showing accumulation vs distribution
Integrated Screening: Filter stocks by BOTH criteria simultaneously:
- "ROE >20% + above 50-day moving average"
- "P/E <industry average + forming ascending triangle pattern"
- "Debt-free companies + relative strength >70"
Smart Alerts: Get notified when:
- Fundamentally strong stock pulls back to technical support (buying opportunity)
- Technically overbought position shows fundamental deterioration (sell signal)
- Quality stock breaks out of multi-month consolidation (momentum entry)
Action Steps to Implement Hybrid Analysis
- Define your timeline - Are you holding weeks, months, or years?
- Start with fundamentals - Screen for quality (our ratios article)
- Add technical filter - Of quality list, buy technically strong
- Set entry rules - Wait for pullbacks or confirmed breakouts
- Use stop-losses - Technical risk management for all positions
- Review quarterly - Fundamental check: is thesis intact?
Stop choosing between fundamental and technical—use both with StockSageAI's integrated analysis platform. Access automated fundamental screening (ROE, P/E, debt, growth metrics) combined with real-time technical analysis (charts, moving averages, support/resistance levels) in a single dashboard. Get dual-signal alerts when fundamentally sound stocks hit technically optimal buy points, or when technical deterioration confirms fundamental concerns. Join hundreds of hybrid investors who've improved returns by 2-4% annually by combining quality selection with precise timing. Start screening with both approaches today at StockSageAI.com—because the best investors don't choose sides, they use all available tools.